Toward a Zero-Carbon Society


2030 Targets and FY2022 Results
The progress of global warming with higher levels of greenhouse gases (GHGs) in the atmosphere has a significant negative impact on people’s lives and society. We are committed to reducing GHG emissions from both our business activities and our products and services for transition to a zero-carbon society.
Based on Eco Action Plan 2030, the progress on group-wide targets as of FY2022 is stated below.
Evaluation:★★★Target achieved★★Slightly below target★Initiative falls short of target
*The table can be scrolled left or right.
| Environmental Vision | FY2022 results | Evaluation |
|---|---|---|
| FY2030 targets (Eco Action Plan 2030) | ||
|
Zero-carbon society |
||
|
|
1 ★★★ |
|
|
2 ★ |
Our Commitment to Climate Change (Response to TCFD Recommendations)
To help create a sustainable society, we have set quantitative and qualitative management targets to be achieved by 2030 as the Mid- to Long-Term Management Goals 2030, stepping up efforts to be carbon neutral by 2050. In July 2021, we announced our support for the recommendations of the Task Force on Climate-Related Financial Disclosures (TCFD). This section shows our scenario analysis, strategies, indicators and targets in line with the TCFD framework for disclosure.
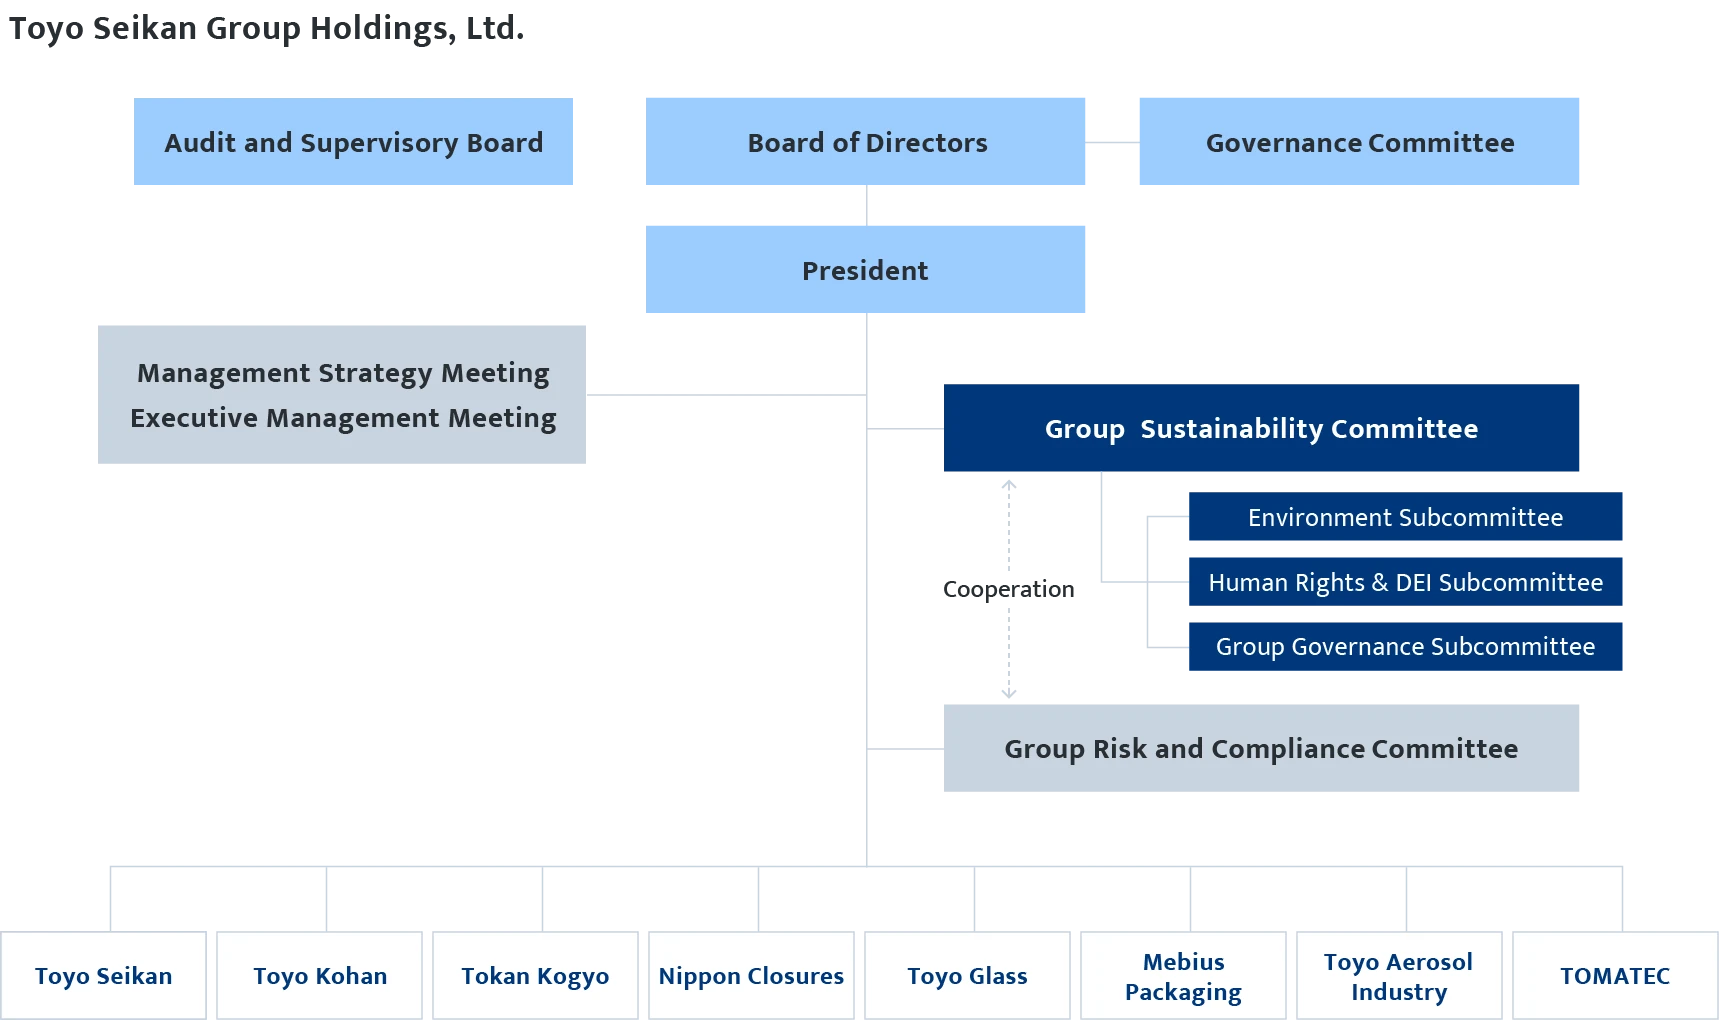
Governance
We established the Group Sustainability Committee to oversee the sustainability-related activities of the entire group, and regard the organization as a key committee of the Group along with the Group Risk and Compliance Committee.
The Group Sustainability Committee is composed of the Company’s President as the chairman and executives from the group responsible for business and corporate affairs, and it meets once a year in principle. The committee discusses matters related to the implementation of sustainability management. It manages current progress in achieving plans and targets and develops new measures after reviewing plans in light of social and international circumstances, legal and regulatory trends, and changes in the external environment. Through ESG working groups placed under the committee’s supervision, it shares and acts on matters before the committee with responsible officers and supervisory departments at each company. The activities of the Group Sustainability Committee are reported to and supervised by the Board of Directors without delay after the committee meeting.
In FY2021, we introduced a performance-linked equity compensation plan for directors (excluding outside directors). As part of the basis for calculating the amount of equity compensation, the plan uses a sustainability index, which is determined by taking account of the general progress on sustainability initiative targets and other ESG-related activities, including climate change targets.
Under this plan, the Company provides uniform treatment of management and execution, in order to enhance its sustainability efforts including climate change adaptation.
*The table can be scrolled left or right.
Strategy
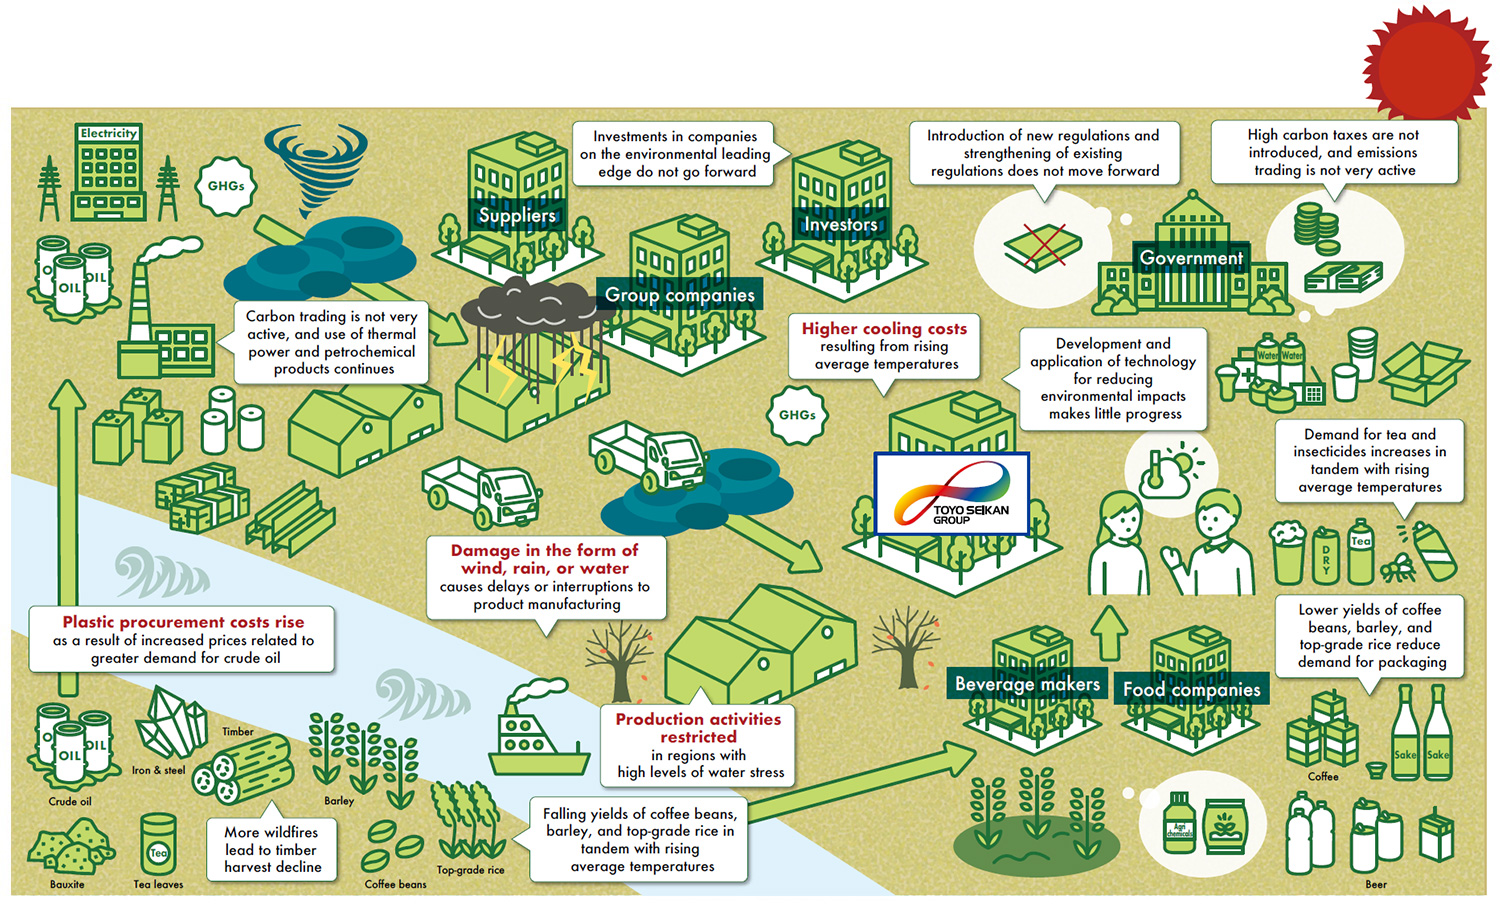
Selecting climate change scenarios
We referred to the climate change scenarios published by the International Energy Agency (IEA), among others, and chose the 1.5–2°C and 4°C warming scenarios. We have analyzed the impact of climate change over the period through 2030, as we understand that such impact becomes gradually apparent over the medium to long term. For FY2023 under review, we have added some business domains that were not considered in FY2022, so that our analysis now covers the major domestic and overseas businesses. Businesses analyzed: Packaging Business; Engineering, Filling and Logistics Businesses; Steel Plate Related Business; Functional Materials Related Business
Global outlook for scenarios
1.5-2℃ scenario (equivalent to RCP 1.9-2.6)
On the downside, we expect increased costs and stricter environmental regulations from introducing carbon taxes and renewable energy, while on the upside we see the greater demand for eco-friendly products as an opportunity to expand.
*The table can be scrolled left or right.
4℃ scenario (equivalent to RCP 8.5)
Action toward decarbonization is relatively muted. On the downside are the likely delays and interruptions to product manufacturing caused by more extreme climate conditions; on the upside is the expected increase in demand for products in conjunction with rising temperatures.
*The table can be scrolled left or right.
Process of scenario analysis
Identifying significant risks and opportunities
- Gather information on risks and opportunities in the packaging industry.
- Identify potential transition and physical risks and opportunities for the Group from the perspectives of government policies and the market.
- Examine impacts of the identified risks and opportunities on our operations and specify significant risks and opportunities which may have material impacts.
Collecting future prediction data
- Collect external future prediction data that is highly reliable on significant risks and opportunities.
- Organize the future prediction data for each scenario and internally discuss possible future prospects.
Estimating business impacts
- Quantify business impacts of significant risks and opportunities for each scenario using collected future prediction data and in-house data.
Taking countermeasures
- Consider measures to address climate change-related risks and opportunities with material impacts on our business.
- Develop a framework to take additional measures, as necessary.
Results of analysis
Transition risks
- For climate change measures implemented under a 1.5–2°C scenario, we have identified the risk, among others, that operating costs may increase due to the imposition of carbon taxes on GHGs.
- Our examination of proposed measures found that a certain amount of negative impact would be reduced by achieving targets in Eco Action Plan 2030. While making use of the internal carbon pricing system (ICP) introduced in FY2022, we are also taking action to invest in GHG reduction. In addition, as we move forward on activities to achieve our targets, we aim to give higher resolution to the financial aspects of individual measures including their integration with financial plans.
Physical risks
- The mounting risk of water shortages in regions with high levels of water stress or, at the other extreme, flooding due to the development of extreme climate conditions, which are both offshoots of our changing climate, have been identified for their large impact on running a business.
- We are lessening the adverse impact from this water risk, including the risk of suffering from water shortages or flooding, through such efforts as building an integrated management system, scheduled to start operations in 2024.
Opportunities
- 1.In the 1.5–2°C scenario, we have also identified opportunities created by the rising demand for battery components and materials for EVs and PHEVs and for eco-friendly manufactured
- After taking a closer look at this coming demand, we are taking the necessary steps to bolster our production system, thereby ensuring that opportunities like these lead to the growth of Toyo Seikan Group.
Chart of analysis results
Transition risks
*The table can be scrolled left or right.
| 2Significant risks and opportunities | Time frame | 1.5–2°C scenario | 4°C scenario | Actions by Toyo Seikan Group | |||
|---|---|---|---|---|---|---|---|
| Policies & regulations | Carbon tax burden |
Medium |
¥10.1bn increase in operating costs from a new carbon tax*1 |
 |
New carbon tax not introduced |
 |
|
| Electricity price fluctuations |
Short |
Increase in operating costs due to higher electricity rates |
 |
Decrease in operating costs from electricity rates |
|
|
|
| Plastic taxes are imposed on packaging made of virgin plastic. |
Medium |
Reduced net sales if the portion for new tax levies is deducted from unit prices |
|
New tax not introduced |
 |
|
|
| Required use of recycled plastics in beverage bottles |
Medium |
Cost increases from proportionately higher content of reused plastics |
|
Required use of recycled plastics in beverage bottles not introduced |
|
|
|
| Fluctuating paper prices due to taxes on harvested timber |
Medium |
Increase in paper costs from taxes on harvested timber levied on paper suppliers |
|
No levying of taxes on harvested timber on paper suppliers |
|
|
|
| Raw material prices | Rise in petrochemical material prices due to higher crude oil prices |
Short |
Decreased procurement costs for petrochemicals due to falling crude oil demand |
 |
Increase in petrochemical procurement costs from higher crude oil prices |
|
|
| Fluctuations in raw material prices due to carbon taxation |
Medium |
Higher procurement costs for petrochemicals, steel, aluminum, paper, and glass from a new carbon tax*1 |
|
New carbon tax not introduced |
|
|
|
| Impact from green steel adoption |
Medium |
Higher steel procurement costs due to adoption of green steel |
|
Green steel not adopted |
|
|
|
| Low-carbon / next-gen technology | Switch to FCV trucks, less cargo by motor vehicle |
Medium |
Lower profits resulting from the cost of shifting to FCVs and modal shift |
|
No progress in shift to FCVs and modal shift |
|
|
- Financial impact under the 1.5°C scenario.
- Targets in Eco Action Plan 2030.
Physical risks
*The table can be scrolled left or right.
| 2Significant risks and opportunities | Time frame | 1.5–2°C scenario | 4°C scenario | Actions by the Toyo Seikan Group | |||
|---|---|---|---|---|---|---|---|
| Climate change | Halt to water intake during water shortages |
Medium |
Restrictions on production activities in regions of elevated water stress |
|
Restrictions on production activities in regions with high levels of water stress |
|
|
| Impact on air conditioning from rising temperatures |
Medium |
Higher operating costs due to increased electric power consumption for summer air conditioning |
|
Higher operating costs due to increased electric power consumption for summer air conditioning |
|
|
|
| Wildfire impact on pulp and paper supply |
Long |
Increase in raw material procurement costs resulting from having more wildfires |
|
Increase in raw material procurement costs resulting from having more wildfires |
|
|
|
| Lower yields of agricultural produce |
Long |
Decline in net sales from lower yields of barley (for beer), coffee beans, and topgrade rice (for sake) |
|
Decline in net sales from lower yields of barley (for beer), coffee beans, and topgrade rice (for sake) |
|
|
|
| More extreme climate conditions | Incurrence of property damage and lost profits |
Short |
Greater occurrence of property damage and lost profit due to higher risk of flooding |
|
Greater occurrence of property damage and lost profit due to higher risk of flooding |
|
|
| Higher insurance premiums |
Short |
Higher insurance costs in tandem with an increase in floods and typhoons |
|
Higher insurance costs in tandem with an increase in floods and typhoons |
|
|
|
Opportunities
*The table can be scrolled left or right.
| 2Significant risks and opportunities | Time frame | 1.5–2°C scenario | 4°C scenario | Actions by the Toyo Seikan Group | |||
|---|---|---|---|---|---|---|---|
| Changes in consumer behavior | Increased demand for eco-friendly products |
Medium |
Increased sales of eco-friendly products |
 |
Demand for eco-friendly products does not rise |
|
|
| Increased demand for insecticides |
Long |
Sales increase in the aerosol filling business as demand for insecticides increases due to rising average summertime temperatures |
|
Sales increase in the aerosol filling business as demand for insecticides increases due to rising average summertime temperatures |
|
|
|
| Expansion of low-carbon products | Adoption of EVs and PHEVs |
Medium |
As demand increases for battery materials used in EVs and PHEVs, so do their sales |
|
As demand increases for battery materials used in EVs and PHEVs, so do their sales |
|
|
Financial impact: Positive, 10 billion yen or more
Positive, less than 10 billion yen
Positive/negative, less than 1 billion yen
Negative, less than 10 billion yen
Negative, 10 billion yen or more
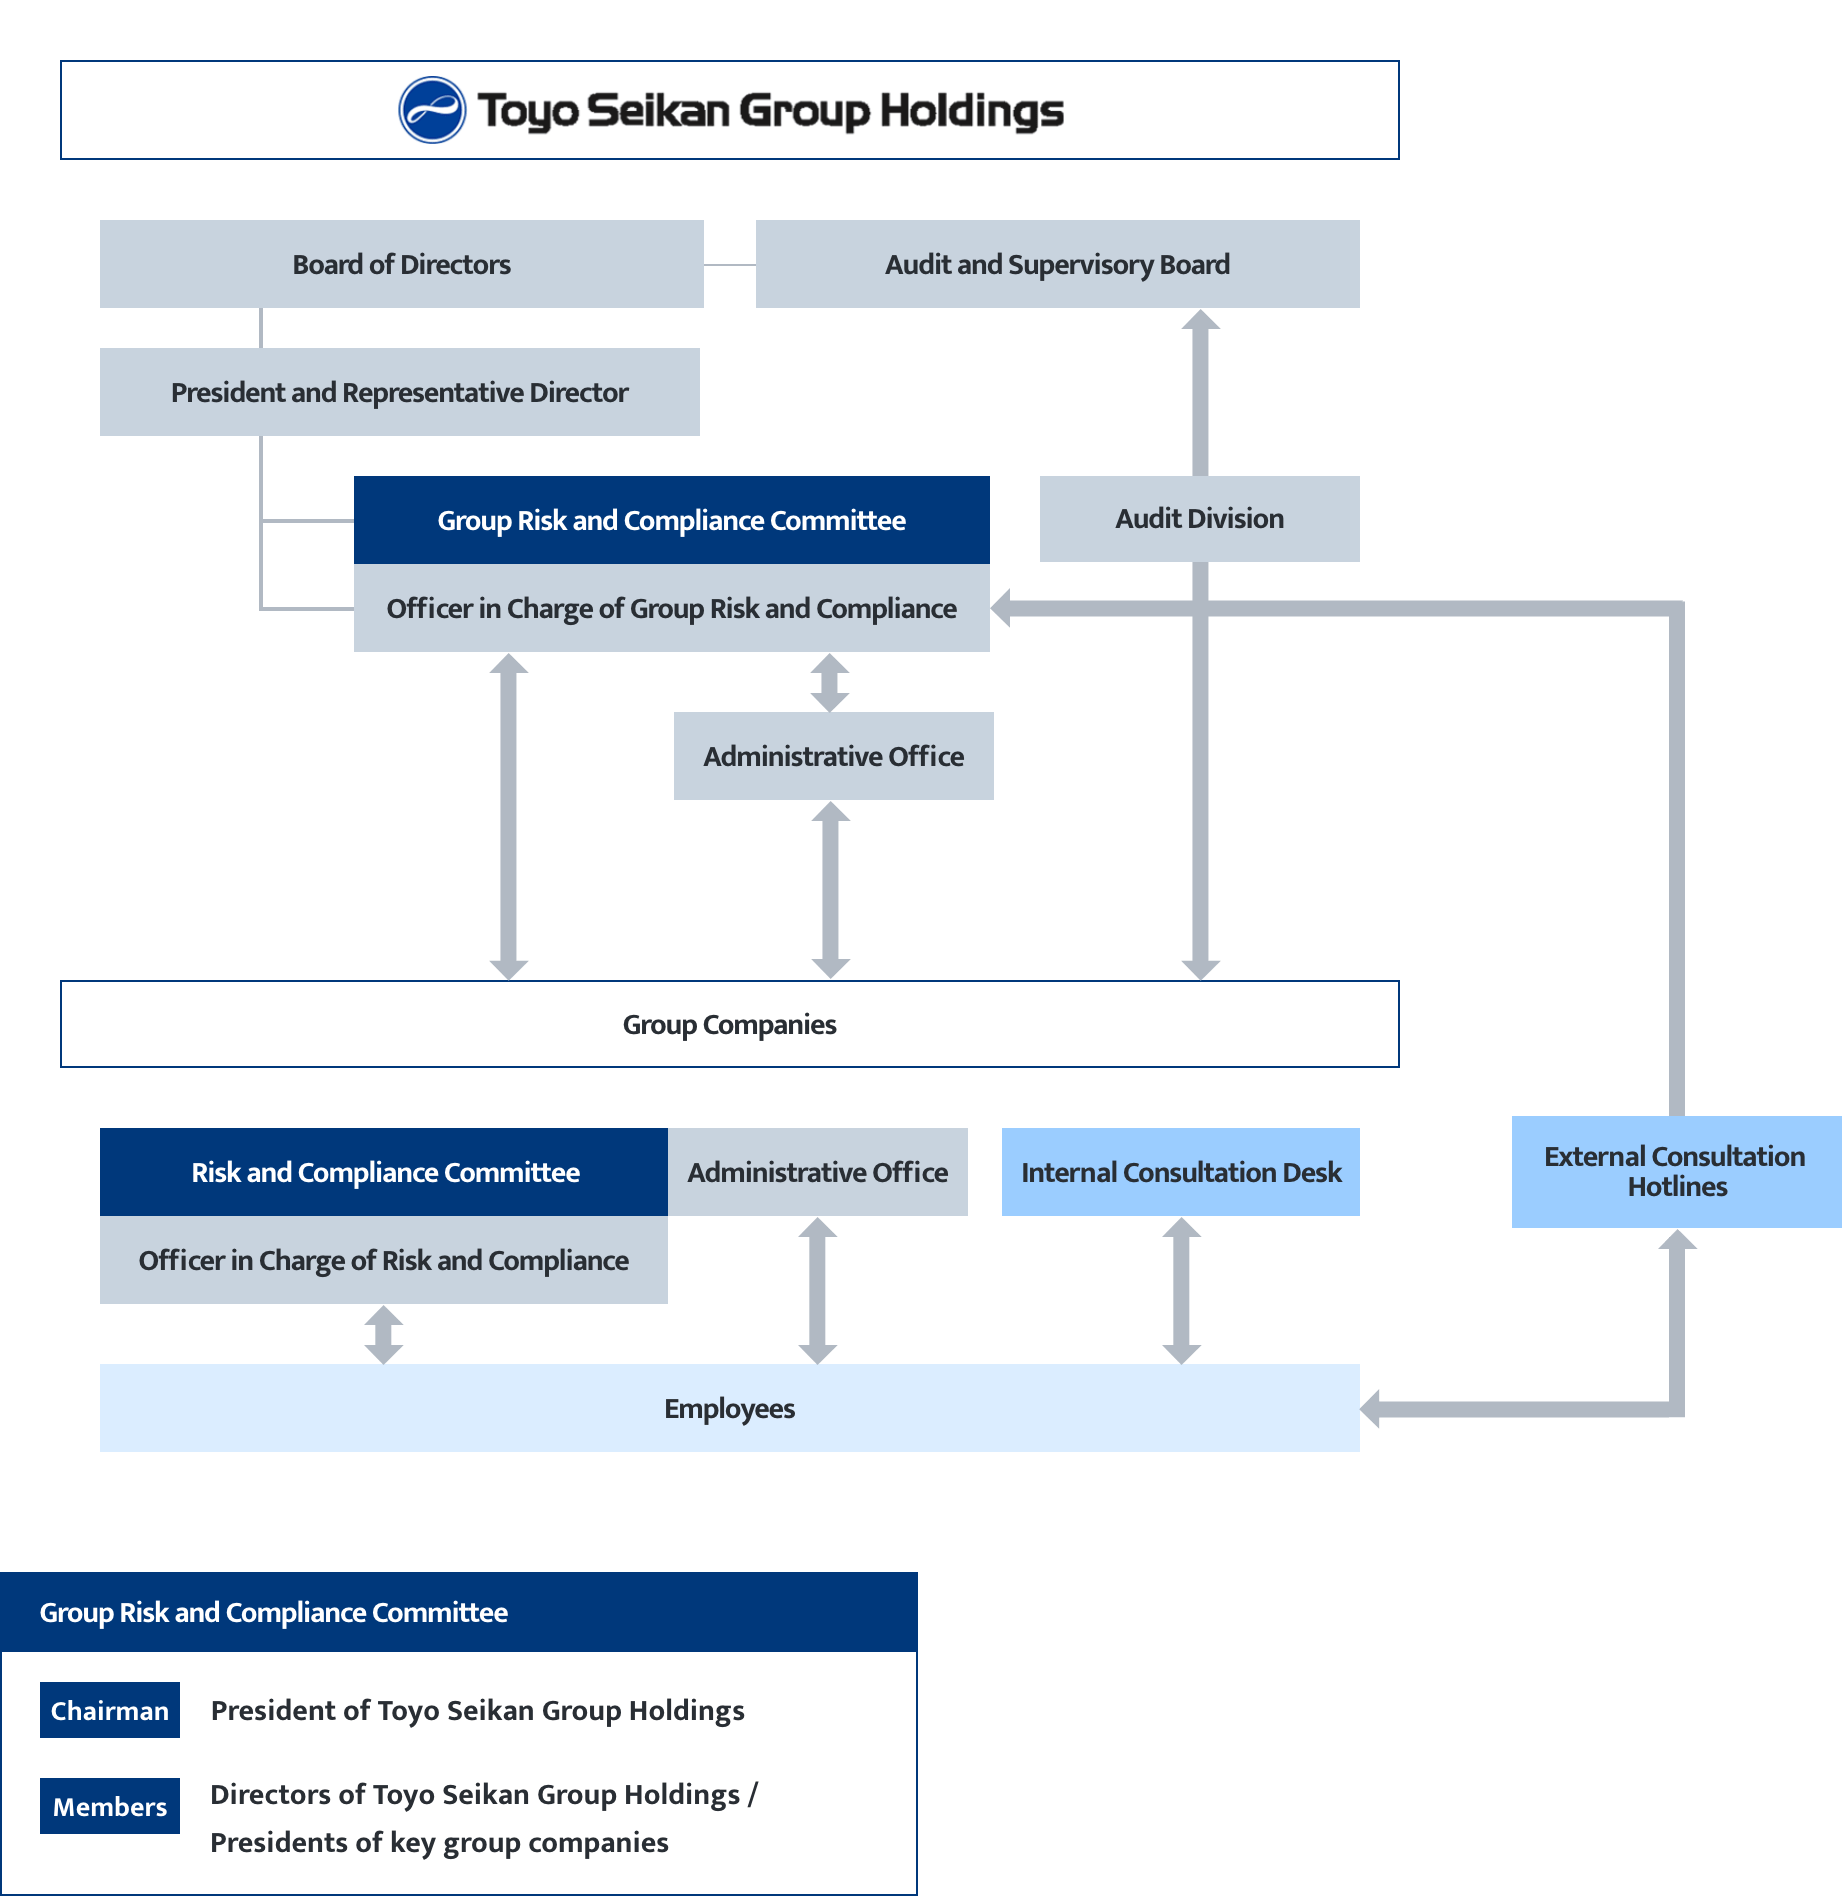
Risk management
Toyo Seikan Group is constructing a risk management system based on the “Group Risk and Crisis Management Rules.” These rules identify eight major risks that have a sizable impact on running our business, and we now point to one of these, environmental risk, which includes climate change. The status of the major risks is being monitored by the Group Risk and Compliance Committee. When needed, the committee will make improvements to the Group’s actions or develop preventive measures.
Major risks related to climate change, which were discussed at the aforementioned Group Sustainability Committee, are being reported on at the Group Risk and Compliance Committee. The matters discussed are being reported on when needed at the Management Strategy Meeting and the Executive Management Meeting, and are reflected in the business strategies.
*The table can be scrolled left or right.
Indicators and targets
Amount of GHG emissions reduced
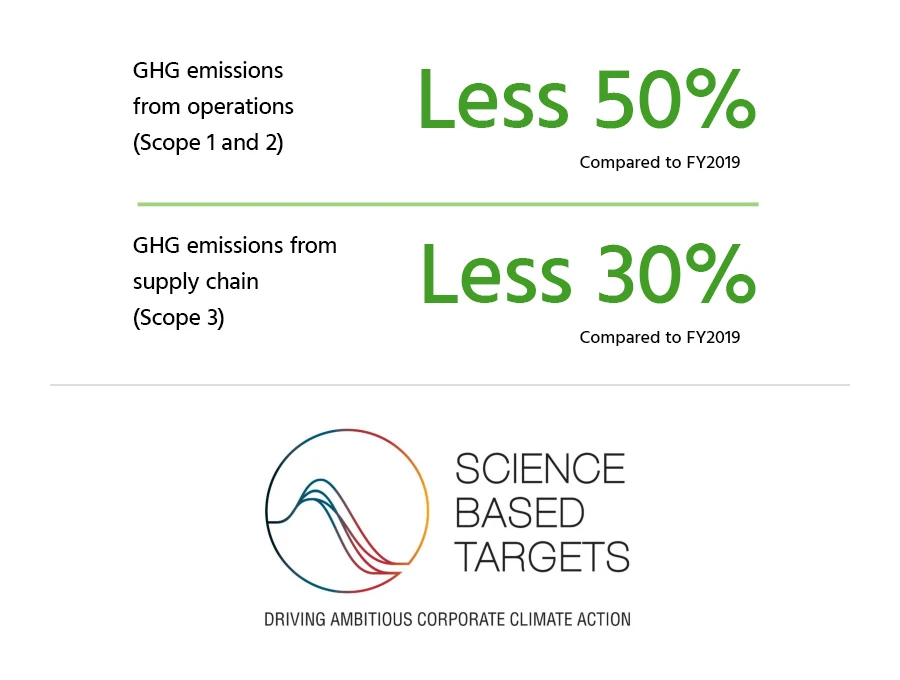
As a long-term goal for 2050, we aim to significantly reduce GHG emissions to realize carbon neutrality. To this end, we have set GHG emissions reduction targets for 2030 in Eco Action Plan 2030 as shown below.
These targets have been approved by the Science Based Targets initiative (SBTi) under its updated target validation criteria for the 1.5°C scenario.
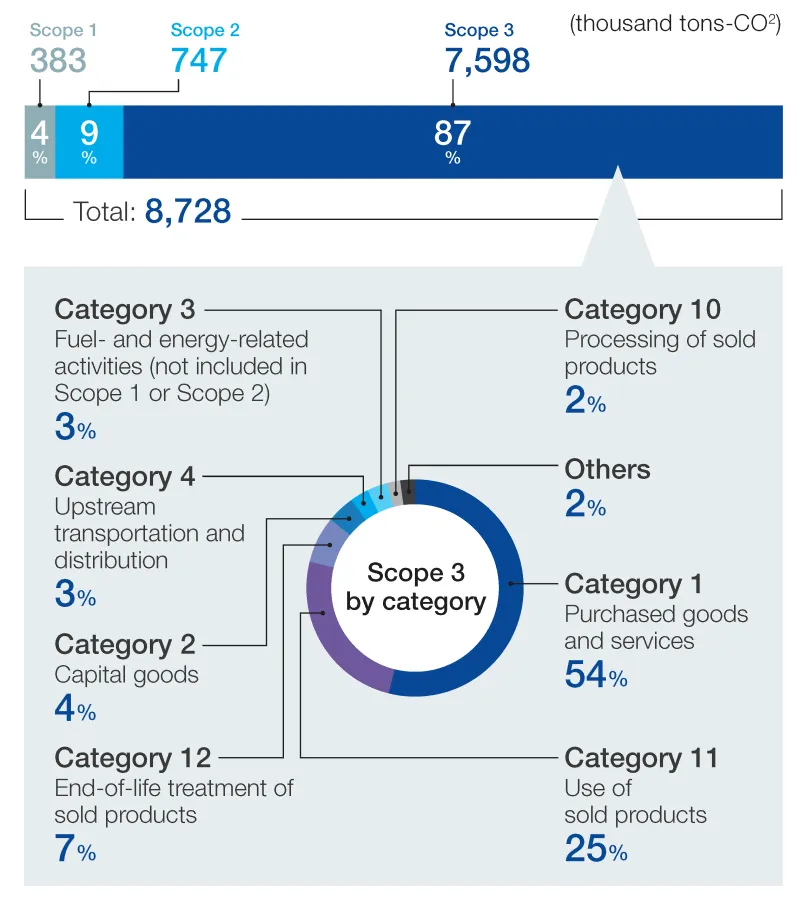
GHG emissions from supply chain (FY2022)
Unit: thousand tons CO2
*The table can be scrolled left or right.
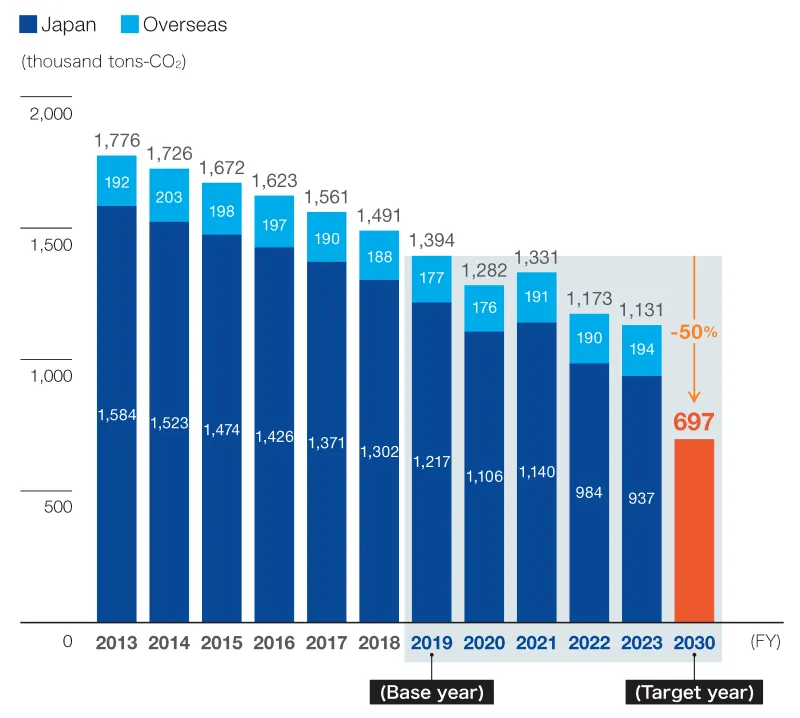
- Note: The figures for past periods have been retrospectively corrected due to double-counted at some overseas facilities.
Changes in GHG emissions from operations
*The table can be scrolled left or right.
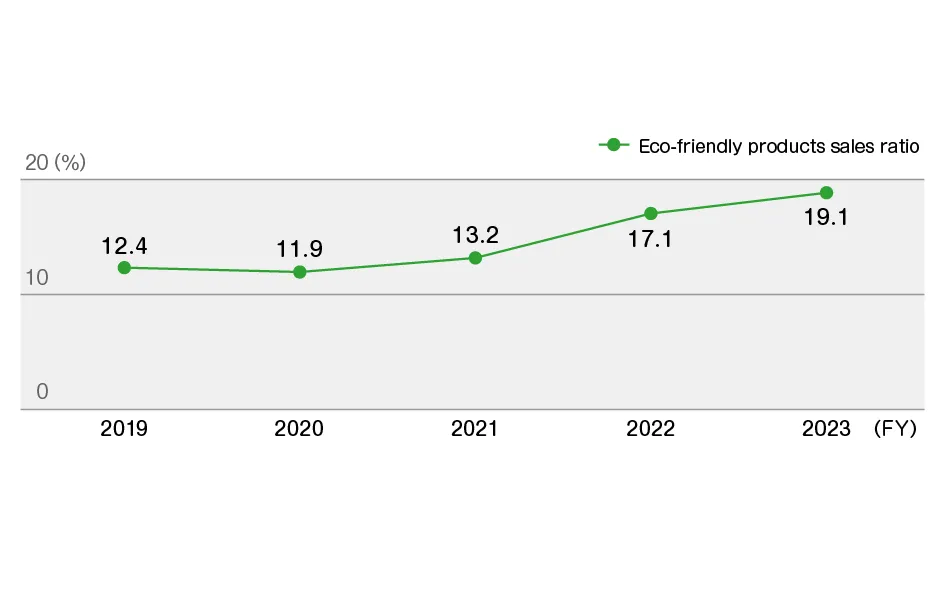
Sales of eco-friendly products as a per cent of total sales
In order to contribute to the realization of a sustainable society, Toyo Seikan Group has set “developing and offering products and services that are environmentally sound” as one of its material issues.
In our analysis of climate change scenarios, we have identified increased sales of ecofriendly products as a result of changes in consumer behavior as a growth opportunity. We consequently track the proportion of such sales as a ratio of total sales as an indicator for grasping progress in this area.
Future actions
Based on the scenario analysis conducted in fiscal 2021, we plan to expand the scope of the analysis to other businesses in fiscal 2022 and to include all our businesses in fiscal 2023.
More Use of Renewable Energy
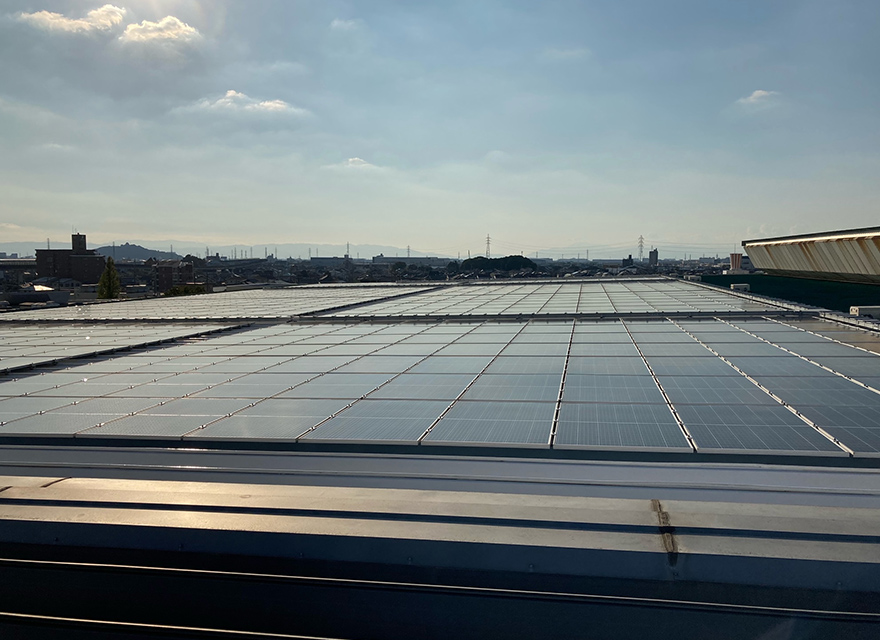
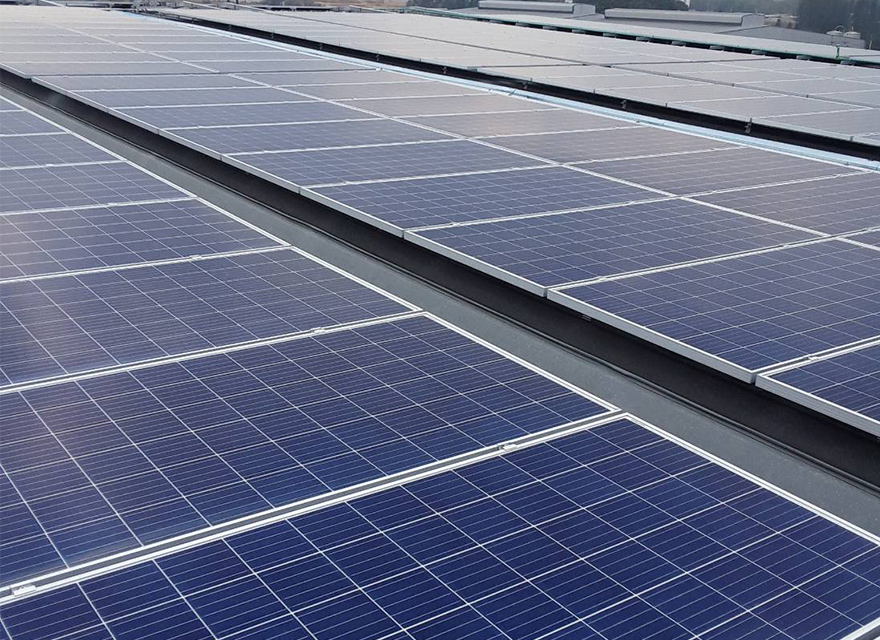
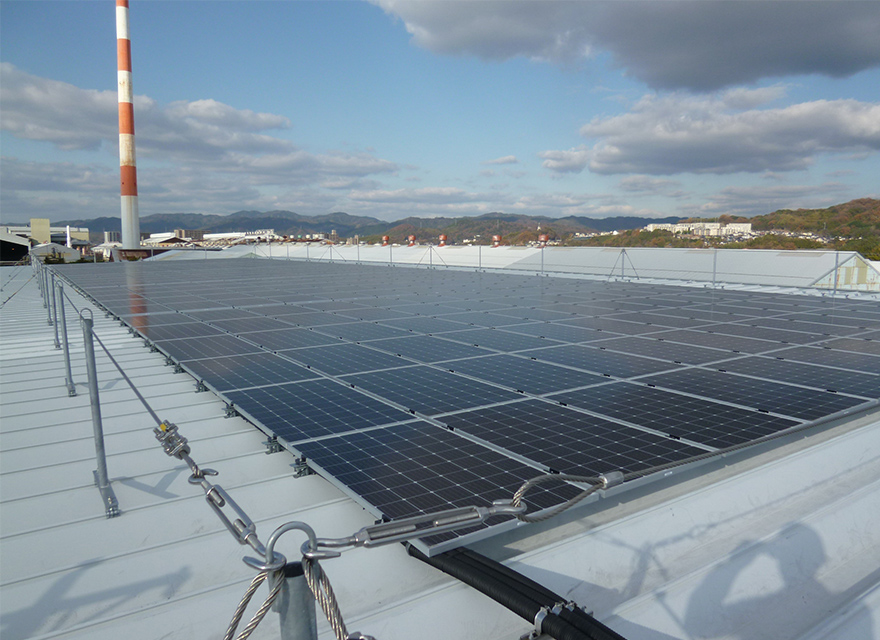
As part of our efforts to reduce greenhouse gas emissions from operations, we have been introducing solar power systems to our facilities.
Installation of solar power systems (excluding systems for electricity business) (as of April, 2023)
*The table can be scrolled left or right.
| Company/plant | Operation started | Annual CO2 reduction (ton-CO2) |
|---|---|---|
|
Nippon Closures / Komaki Plant |
March 2019 |
360 |
|
Toyo Seikan (Thailand) |
October 2019 |
280 |
|
Toyo Filling International (Thailand) |
August 2020 |
100 |
|
Tokan Kogyo / Komaki Plant |
December 2020 |
240 |
|
Toyo Kohan / Kudamatsu Plant |
February 2021 |
80 |
|
Toyo Mebius’ Kumagaya |
March 2023 |
122 |
Komaki Plant of Tokan Kogyo
Toyo Filling International
Kudamatsu Plant of Toyo Kohan
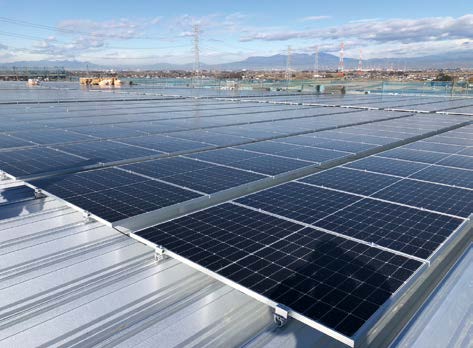
Toyo Mebius’ Kumagaya Logistics Center
Promoting Modal Shift
We have committed ourselves to more efficient transportation with less environmental impact by making active efforts to build an efficient truck transportation system and promote modal shift.
Our Previous Efforts
*The table can be scrolled left or right.
| October 2015 |
Toyo Glass Logistics |
Start using 31-foot large containers to achieve efficient transportation |
|---|---|---|
| December 2017 |
Toyo Seikan |
Start using 31-foot large containers |
| November 2018 |
Toyo Mebius |
Receive the 5th Grand Prize in the Award for Excellent Business Entities Working on Modal Shift |
| September 2019 |
Tokan Logitech |
Certified in Planning for Integration and Streamlining of Distribution by the Ministry of Land, Infrastructure, Transport and Tourism under the Act on Advancement of Integration and Streamlining of Distribution Business |
| April 2021 |
Toyo Seikan |
Recognized as a certified business under the Eco Ship Modal Shift Project for 2020 |
We as a whole group will continue to advance our commitment to reducing environmental impact for the creation of a sustainable world.
Promotion of 3R and climate change mitigation activities with container packaging related organizations.
Toyo Seikan Group manufactures seven of the eight major packaging materials used in Japan --- steel cans, aluminum cans, plastic packaging, PET bottles, paper containers, paper beverage containers, cardboard, and glass bottles. Additionally, we are actively involved in promoting 3R (Reduce, Reuse, Recycle) by serving as directors and committee members in each material organizations and their alliances, contributing membership fees as a key member to conduct climate change mitigation activities, including the reduction of greenhouse gas emissions ,
In response to the "2050 Carbon Neutral Declaration “ announced by the Japanese government in October 2020, which aims to realize a decarbonized society by 2050 and reduce greenhouse gas emissions to net zero, Toyo Seikan Group shifted its goal in 2021 from aiming for a "low-carbon society" to achieving a "decarbonized society" with carbon neutrality by 2050, and upwardly revised its medium to long-term goals for the fiscal year 2030 at the same time. Furthermore, Toyo Seikan Group supports national climate change-related regulations, such as the "Act on Rational Use of Energy and Other Measures for Energy Conservation" (Energy Conservation Act) and the "Act on Promotion of Global Warming Countermeasures" (Global Warming Countermeasures Act), and submits reports annually to the government on energy usage, progress toward energy conservation targets, and greenhouse gas emissions. We also actively engage in the TCFD recommendations promoted by the government and disclose relevant information.