Capital Efficiency Initiative 2027


Capital Efficiency Initiative 2027
We launch a new initiative aiming to achieve an ROE of 8% or more for fiscal 2027, pursuing both our growth strategy and capital and financial strategy
2025
Mid-Term Management Plan 2025
Action plan to address management issues and achieve Mid- to Long-Term Management Goals
[KPI]
- ROE: 5.0%
- Net sales: 850 billion yen / Operating income: 50 billion yen
- EBITDA: 110 billion yen
[Three key issues]
- Continuous growth in existing business domains
- Exploring, commercializing and monetizing new growth opportunities
- Enhancing management foundation to support growth
2027
Capital Efficiency
Initiative 2027
Measures to achieve business management that pays close attention to capital costs and the stock price
[KPI]
- ROE: 8.0% or more
- Operating income: 65 billion yen
- EBITDA: 120 billion yen
- Profit (Net income):48 billion yen
- Equity capital: 600 billion yen
- Share repurchase: 100 billion yen (Total for 5 years)
[Basic approaches]
- Growth strategy
- Optimizing business portfolio
- Capital and financial strategy
- Improving asset efficiency
2030
Mid- to Long-Term Management Goals 2030
Quantitative/qualitative targets to realize our long-term management vision
[Economic value]
- Net sales: 1 trillion yen
- Operating income: 80 billion yen
[Social and environmental value]
- Contributing to environmental protection through the Eco Action Plan 2030
- Building a sustainable value chain
- Creating a workplace that allows members with various characteristics to develop and demonstrate their own abilities
Measures to achieve an ROE of 8% or more
Aiming to achieve an ROE of 8% or more by increasing profits (R) and lowering equity capital (E).
Improvement in R: Operating profit (FY2023-FY2027)

By optimizing the business portfolio
Aiming for operating profit of 65 billion yen
Compression of E: Equity capital (cumulative total for fiscal years 2023 to 2027)
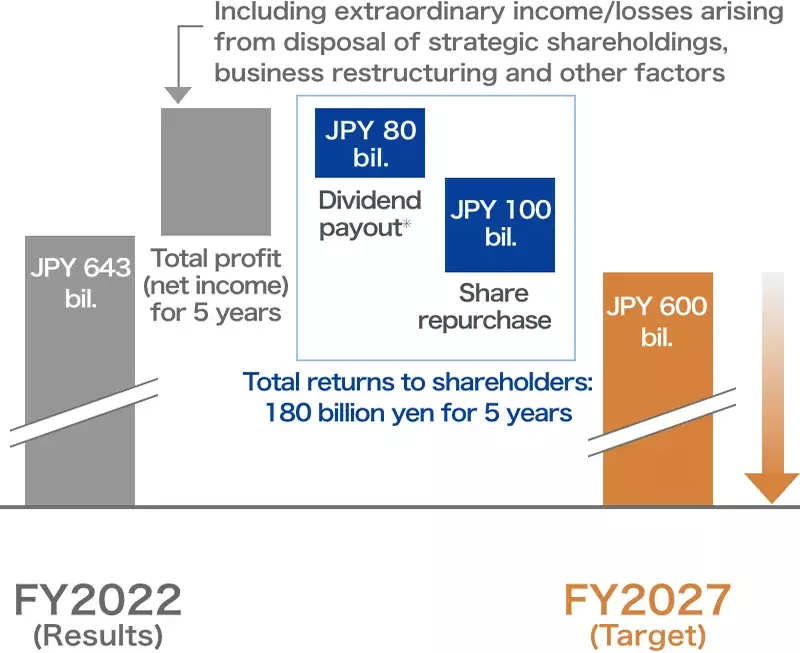
Strengthening shareholder returns, etc.
Aiming for equity capital of 600 billion yen
- The dividends for FY2026 and FY2027 are assumptions based on the planned level for FY2025, and the dividend plans for the years will be determined based on actual earnings.
Growth strategy
Optimizing business portfolio
- Allocate more resources to growth areas of the engineering/filling/logistics, steel plate related, and functional materials related businesses.
- Seek appropriate cost pass-through and streamline and restructure unprofitable operations mainly in the domestic packaging business.
- The table can be scrolled left and right
| (in billions of yen) | FY2022 | FY2023-FY2025 | FY2026-FY2027 | FY2027 targets |
|---|---|---|---|---|
| PackagingRestructuring | Net sales: 544.4 Operating income: -10.7 Operating income margin: -2.0% |
Cost pass-through efforts
(30 to 35 billion yen)
|
Net sales: 600.0 Operating income: 30.0 (+40.7) Operating income margin: 5.0% |
|
|
Restructure unprofitable operations.
|
||||
|
Reduce environmental impact. / Promote automation, labor saving and other cost cutting efforts.
|
||||
| Engineering/Filling/Logistics Growth (partial restructuring) |
Net sales: 198.3 Op. income: 8.7 Op. margin: 4.4% |
Restructure unprofitable operations.
|
Net sales: 190.0 Op. income: 13.0 (+4.3) Op. margin: 6.8% |
|
|
Improve profitability by tapping into the growing global market for can making machines. (Engineering) /
Increase production capacity in Asian markets with high growth potential. (Filling) |
||||
| Steel PlateGrowth | Net sales: 86.5 Op. income: 4.6 Op. margin: 5.4% |
Invest in production of materials and components for automotive rechargeable batteries, which are rapidly growing.
|
Net sales: 110.0 Op. income: 7.0 (+2.4) Op. margin: 6.4% |
|
| Functional MaterialsGrowth | Net sales: 45.7 Op. income: 2.0 Op. margin: 4.4% |
Pursue growth through the expansion of business areas by leveraging our technologies in optical and other functional films.
|
Net sales: 60.0 Op. income: 6.0 (+4.0) Op. margin: 10.0% |
|
| Cross-segment Growth Areas Growth |
Continue to expand components and engineering operations in the mobility market.
|
Net sales: 80.0 Op. income: 6.0 (+6.0) |
||
|
Expand filling and packaging manufacturing operations
through M&As in growing overseas markets, particularly in South East Asia. |
||||
Capital and financial strategy
Improving asset efficiency
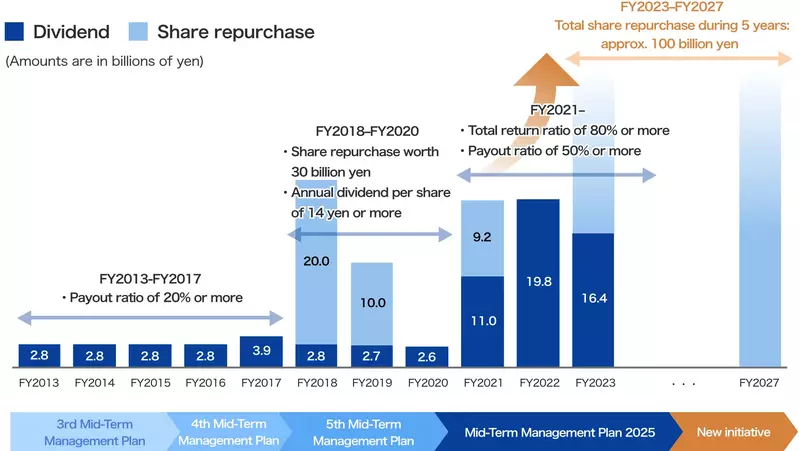
- Substantially increase returns to shareholders through dividend payment and share buybacks, which we have gradually enhanced.
- Further reduce “strategic shareholdings” (incl. cross-shareholdings).
- Reduce assets in unprofitable operations and streamline real estate management (disposal and adding value).
- The table can be scrolled left and right
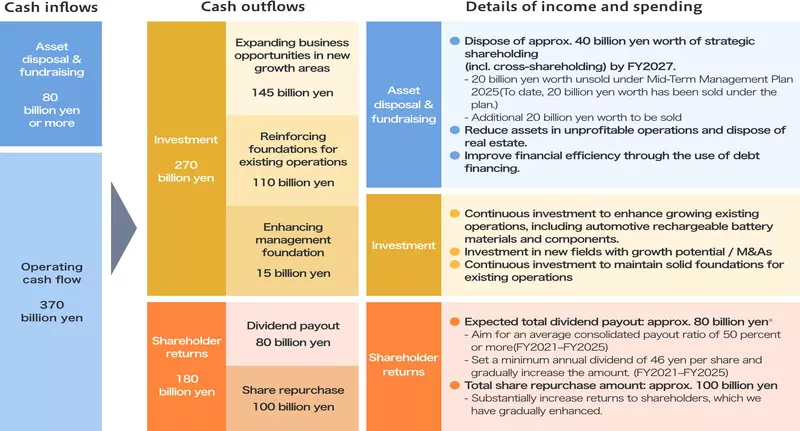
Cash Allocation (FY2023-FY2027)
Seeking business growth and higher returns on capital, we will strategically allocate funds obtained from operating cash flows and through asset disposal and fundraising to investment activities and shareholder returns.
- The table can be scrolled left and right
- The dividends for FY2026 and FY2027 are assumptions based on the planned level for FY2025, and the dividend plans for the years will be determined based on actual earnings.
Financial Targets
New targets for profit and equity capital for fiscal 2027 to further improve capital efficiency
- The table can be scrolled left and right
| New initiative | |||||
|---|---|---|---|---|---|
| FY2022 results | FY2025 | FY2027 | FY2030 | ||
| Earnings | Net sales | 906 billion yen | 850 billion yen *1 | - 1,050 billion yen (For reference) |
1,000 billion yen *1 |
| Operating income | 7.3 billion yen | 50 billion yen | 65 billion yen | 80 billion yen | |
| EBITDA | 60.3 billion yen | 110 billion yen | 120 billion yen | - | |
| Net profit | 10.3 billion yen | 35 billion yen | 48 billion yen | ||
| Returns on capital | ROE | 1.6% | 5.0% | 8.0% or more | |
| Equity capital (Additional target) | 643 billion yen | - | 600 billion yen | ||
| FY2022 results | FY2021-2025 | FY2023-2027 | |||
| Returns to share-holders | Consolidated payout ratio (%) (Dividend per share) |
156% (89 yen) |
Target 50% or more (Minimum 46 yen, to be gradually increased) |
Same as left Total payout for 5 years: 80 billion yen*2 |
|
| Total return ratio (%) (Share repurchase) |
156% (-) |
Target 80% or more (9.2 billion yen worth already repurchased) |
Total repurchase for 5 years: 100 billion yen |
||
- The sales targets for FY2025 and FY2030 have remained unchanged since the current sales growth reflects the impact of currency fluctuations and efforts to pass on higher energy costs to customers, among other factors.
- The dividends for FY2026 and FY2027 are assumptions based on the planned level for FY2025, and the dividend plans for the years will be determined based on actual earnings.